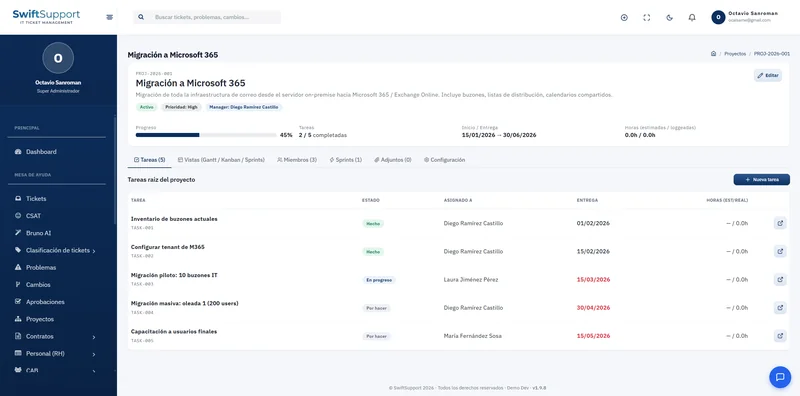
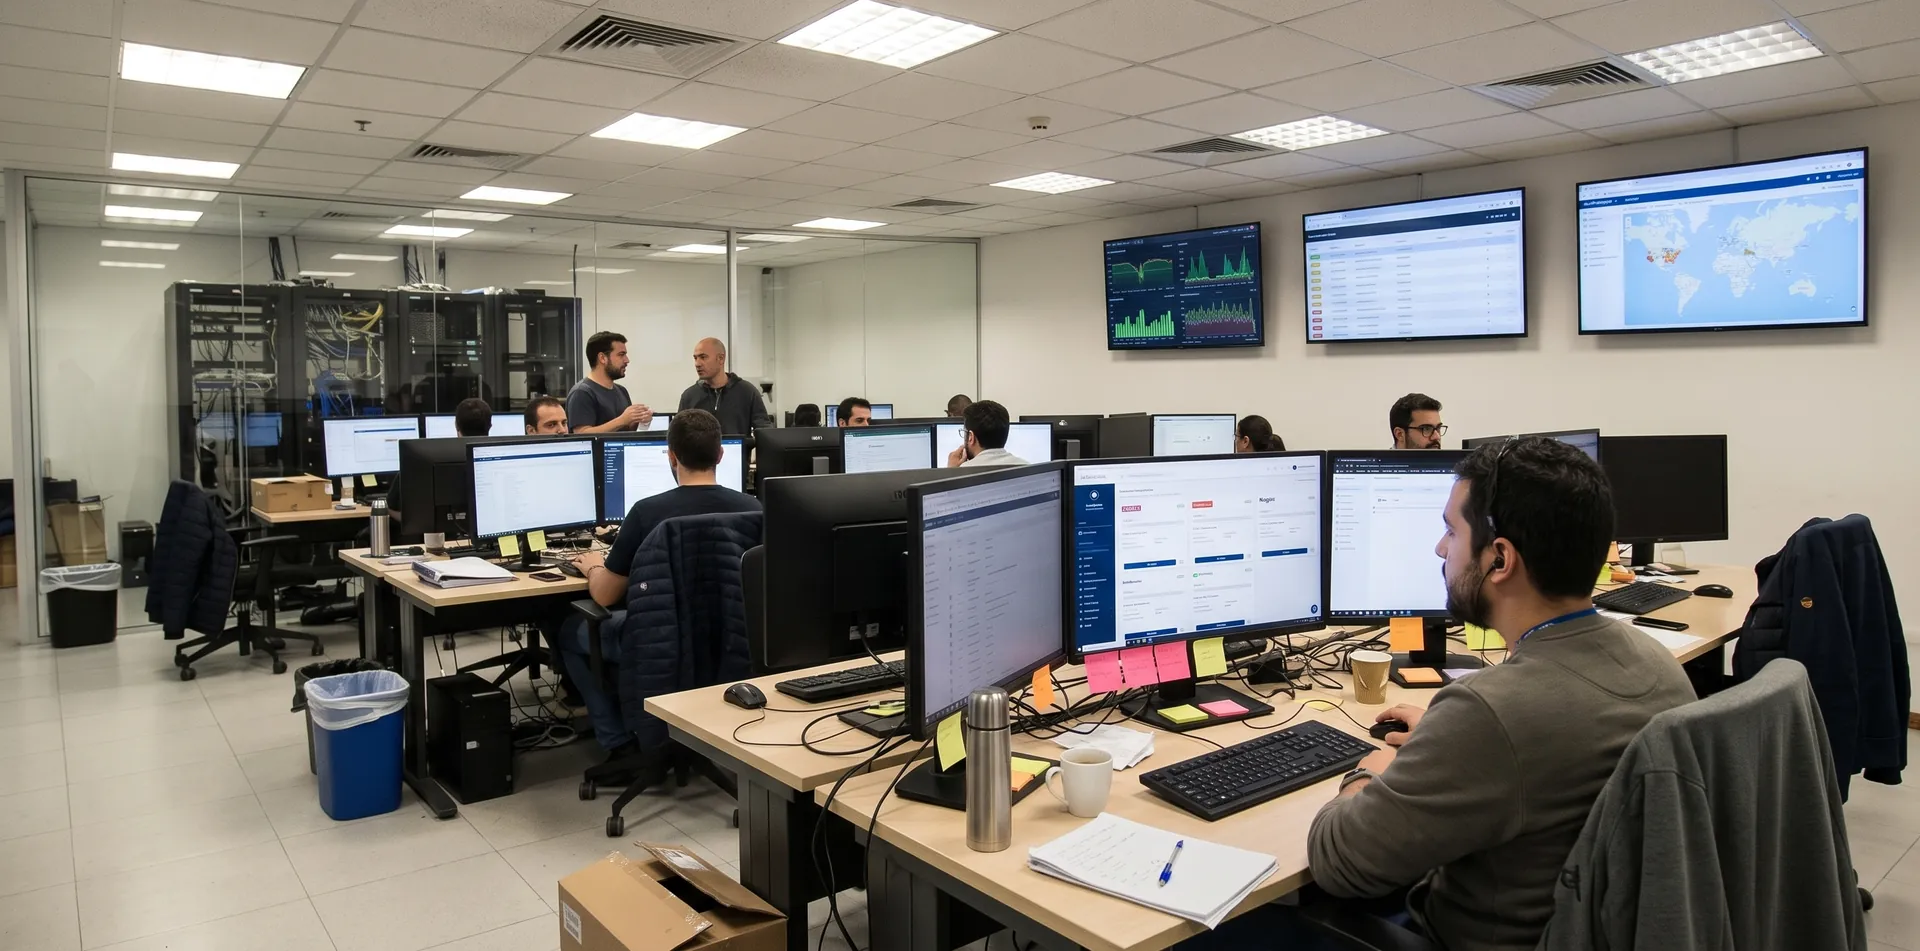
Let your monitoring catch the outage, not a customer complaint. Swift Support receives alerts from your monitoring tools and opens the incident automatically, ready to be handled.
What it is and how it helps
Your organization probably already monitors servers, networks and services with specialized tools. The problem is that those alerts live in another console and someone has to see them, interpret them and open the ticket by hand. Monitoring Integrations connects both worlds.
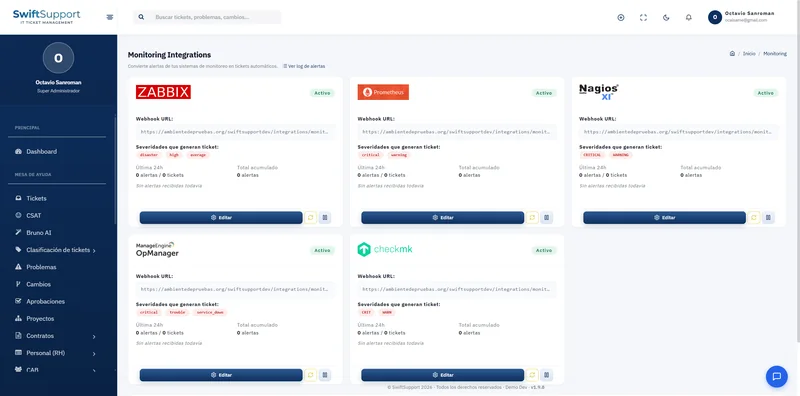
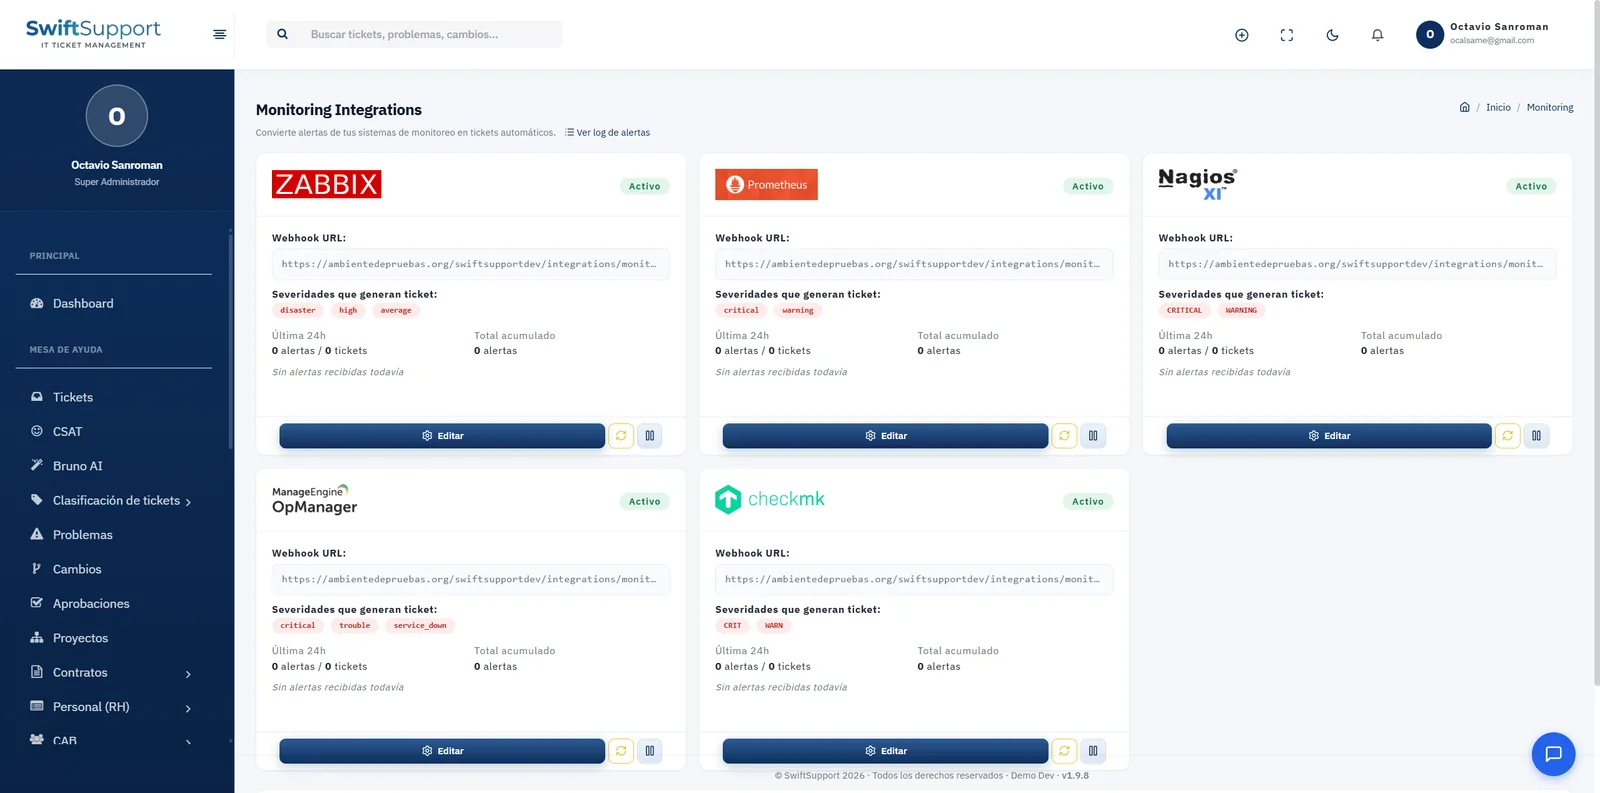
Swift Support includes ready-made integrations for Zabbix, Prometheus, Nagios XI, ManageEngine OpManager and checkmk. Each one has its own webhook URL that you configure in your monitoring tool; from then on, alerts reach Swift Support and become tickets.
Not every alert deserves a ticket. That is why each integration defines which severities create one, using each tool’s own naming: for example disaster, high and average in Zabbix; critical and warning in Prometheus; CRITICAL and WARNING in Nagios XI; critical, trouble and service_down in OpManager; CRIT and WARN in checkmk. Swift Support does not replace your monitoring: it connects it to your service desk.
Key capabilities
Five ready-made integrations
Zabbix, Prometheus, Nagios XI, ManageEngine OpManager and checkmk.
Webhook per integration
Each tool has its own URL to send alerts to.
Severity filter
Choose which severities create a ticket and which are ignored.
Automatic ticket
Each relevant alert opens an incident that enters the normal handling and SLA flow.
Stats per integration
Alerts and tickets in the last 24 hours and running totals.
Alert log
Review the log of received alerts for troubleshooting and audit.
Enable or pause
Turn each integration on or off independently.
How it works
-
01
Enable the integration
Choose your monitoring tool and copy its webhook URL.
-
02
Configure delivery
In Zabbix, Prometheus, Nagios XI, OpManager or checkmk, point notifications to that URL.
-
03
Define severities
Select which severity levels should become tickets.
-
04
Handle the incident
The alert arrives as a ticket, is assigned by your rules and its SLA starts running.