
Your infrastructure topology, drawn and saved alongside your operation. The diagram editor lets you map servers, networks and applications without external tools.
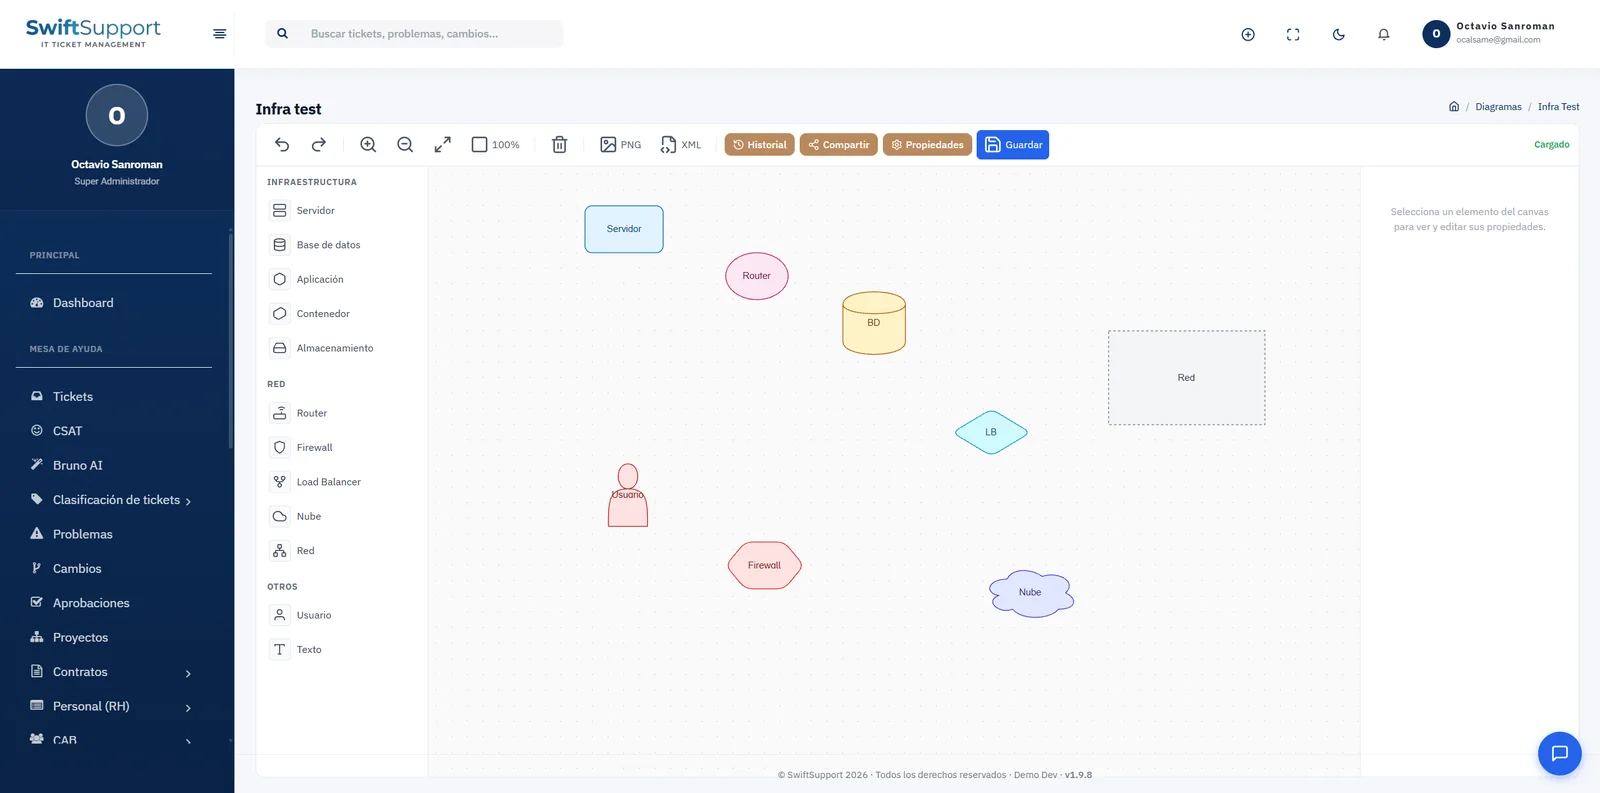
What it is and how it helps
Network diagrams usually live in scattered files nobody can find when they are needed most. In Swift Support, diagrams are part of the platform: any agent with permission can consult them while handling an incident or planning a change.
The visual editor includes a palette organized by families. Infrastructure: server, database, application, container and storage. Network: router, firewall, load balancer, cloud and network segment. Other: user and text. Each shape keeps its representative icon when placed on the canvas, so the diagram can be read at a glance.
The toolbar offers undo and redo, zoom, fit to screen, delete, a properties panel and save. Every diagram keeps a version history, can be shared and can be exported to PNG for documents or to XML for backup or editing in other tools.
Key capabilities
Infrastructure palette
Server, database, application, container and storage.
Network palette
Router, firewall, load balancer, cloud and network segment.
Representative icons
Each shape keeps its icon on the canvas for instant reading.
Version history
See how the diagram has evolved over time.
Sharing
Share the diagram with whoever needs it.
Export to PNG and XML
An image for documents and XML for backup or external editing.
Properties panel
Edit the properties of each selected element.
How it works
-
01
Create the diagram
Give it a name and open the canvas.
-
02
Drag and connect
Place elements from the palette and connect them to represent the topology.
-
03
Document
Adjust the properties and labels of each element.
-
04
Save and share
Save versions, share or export to PNG or XML.