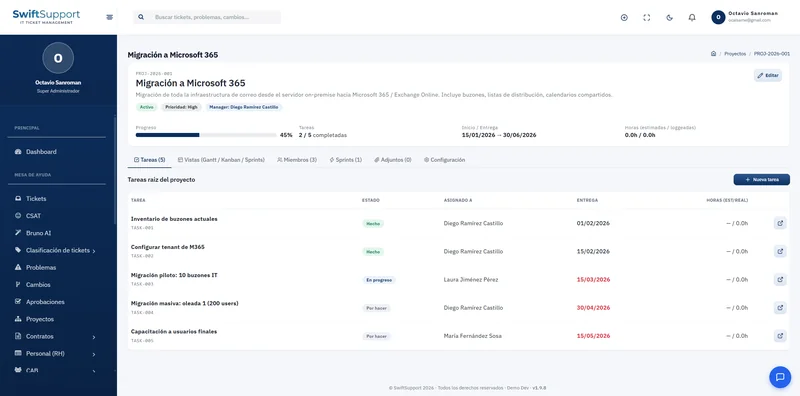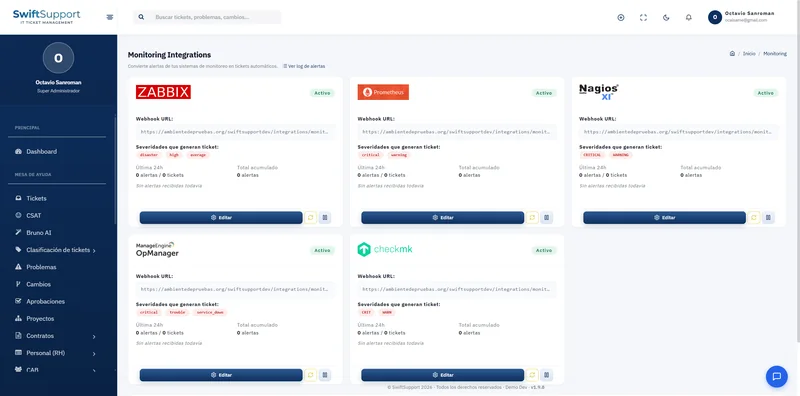
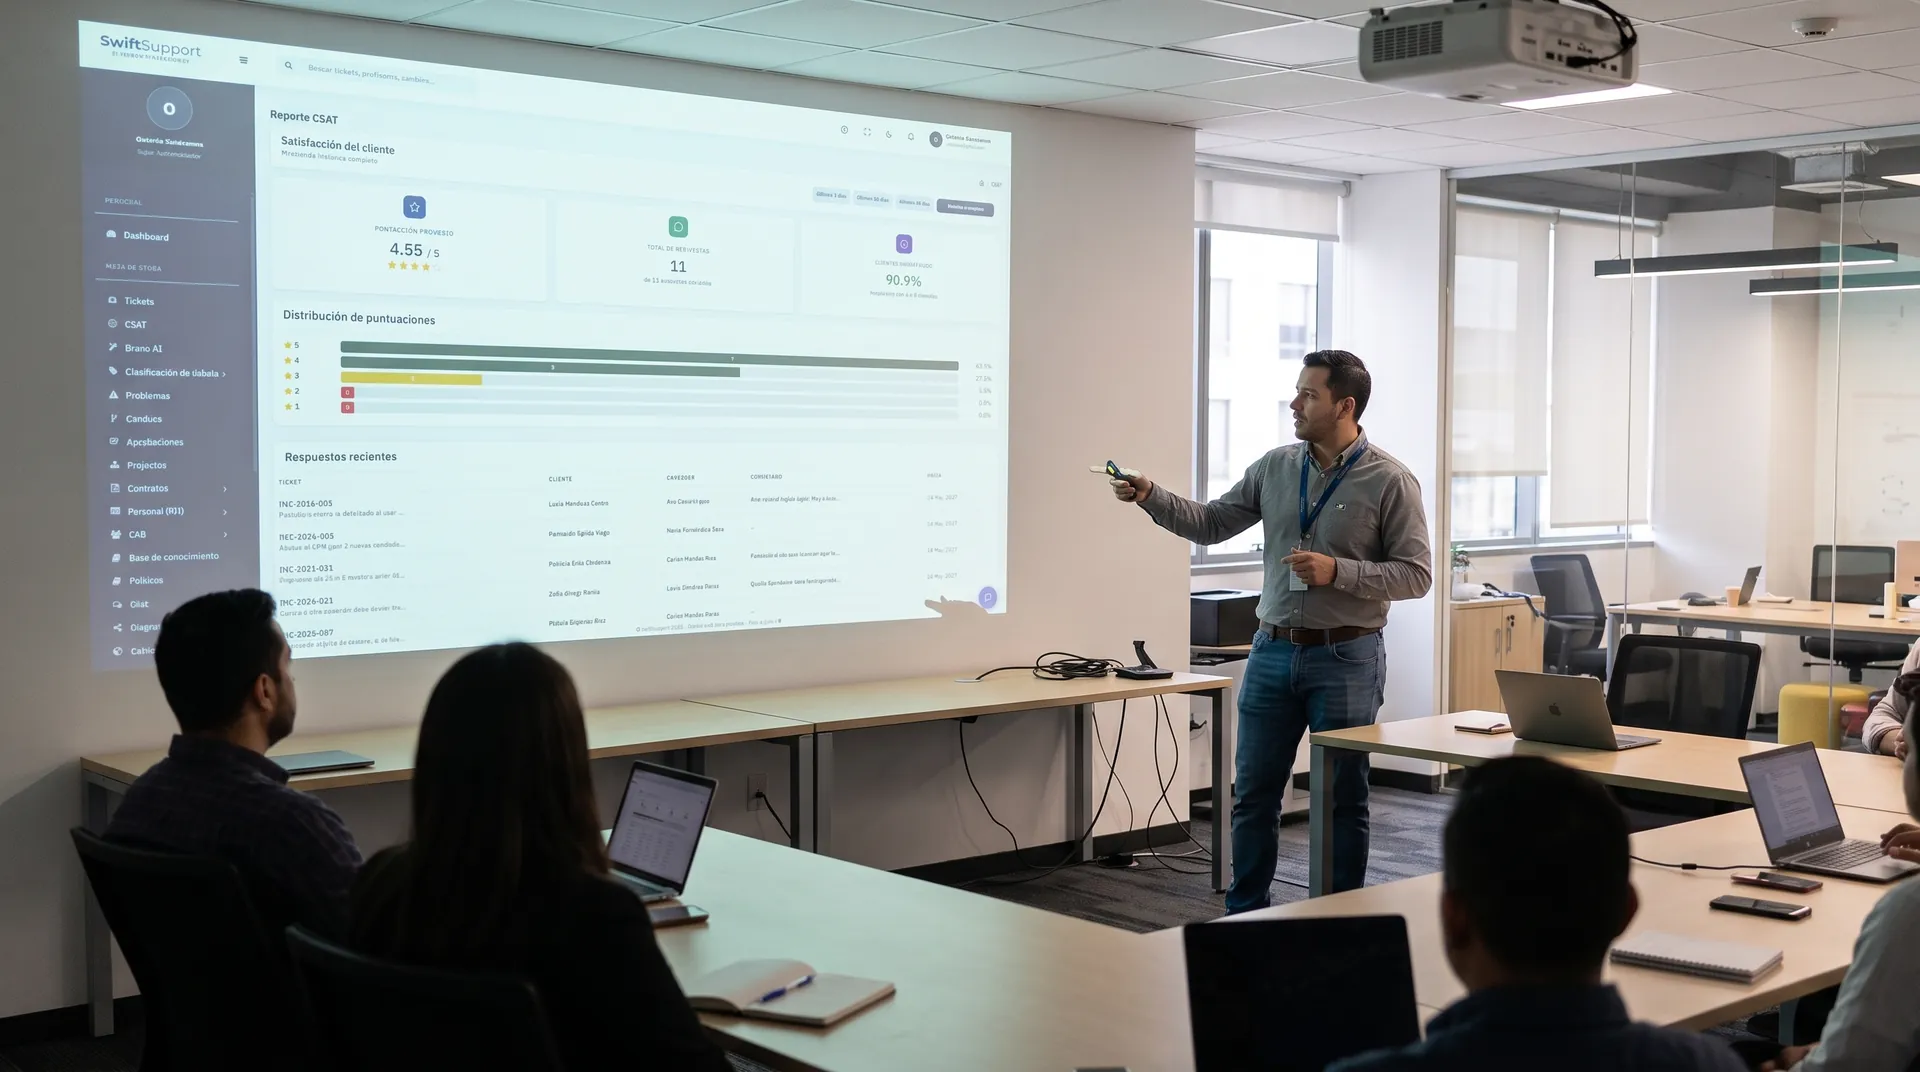
Knowing how well you serve your users should not be a hunch. When each ticket is resolved, Swift Support invites the user to rate the service and turns those answers into clear indicators.
What it is and how it helps
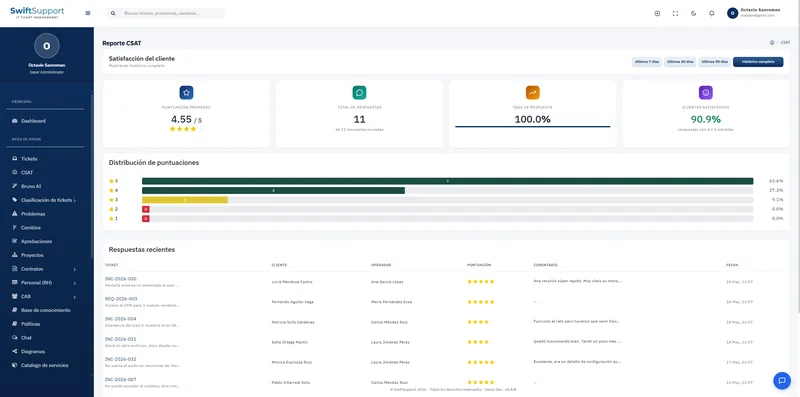
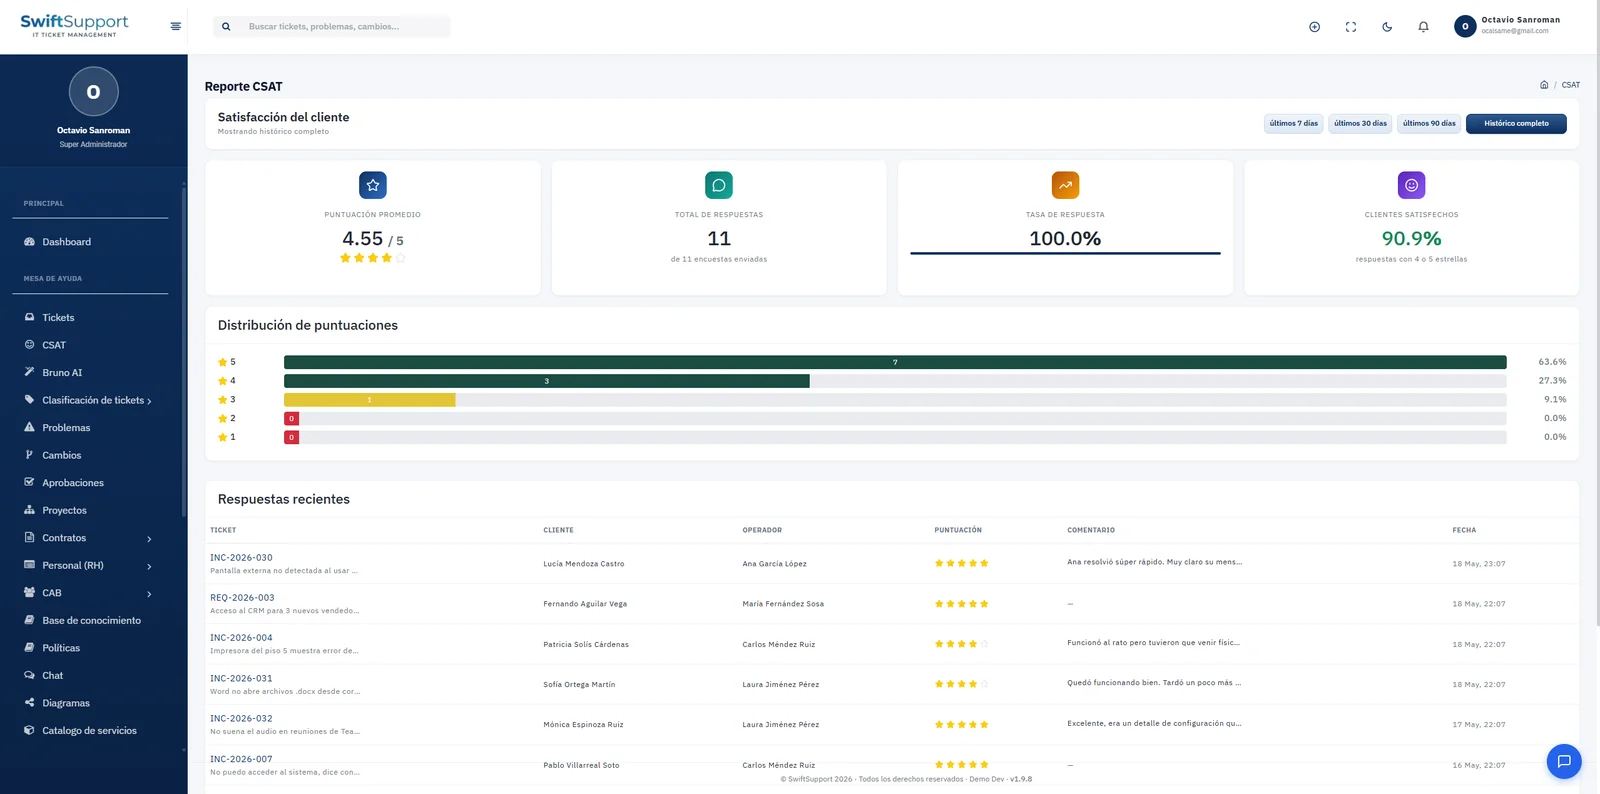
The CSAT report sums up your users’ perception in four indicators: average score out of 5, total responses versus surveys sent, response rate and percentage of satisfied customers (those who rate 4 or 5). You can view it for the last 7, 30 or 90 days or for the full history.
The score distribution shows how many responses fall into each level, from one to five stars, and the recent responses section links each rating to its ticket, customer, agent, comment and date. That way you can recognize good service and follow up on any low rating.
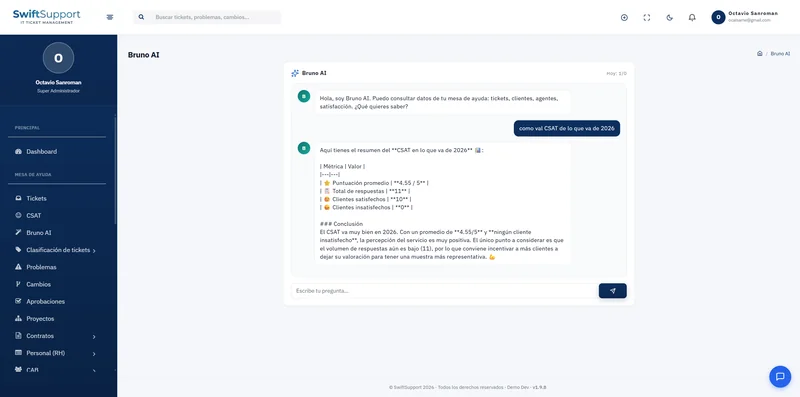
Surveys and the invitation and thank-you messages are configured in Settings → CSAT, with templates that reflect your organization’s tone. The average CSAT also appears on the dashboard and can be queried in plain language with Bruno AI.
Key capabilities
Automatic survey
Sent when the ticket is resolved, with no manual work from the agent.
Average score
Star rating out of 5, by period or for the full history.
Response rate
Surveys answered versus sent, to validate how representative the results are.
Satisfied customers
Percentage of 4- and 5-star responses, the indicator management understands.
Rating distribution
How many responses fall into each level, to spot trends.
Comments per ticket
Each response links to the ticket, customer and agent, with the user’s comment.
Customizable messages
Invitation and thank-you templates in your brand’s tone.
How it works
-
01
The ticket is resolved
When it is marked as resolved, the system prepares the survey for the requester.
-
02
The user rates
They receive the invitation, choose one to five stars and can leave a comment.
-
03
Data is consolidated
The CSAT report and the dashboard are updated with the new response.
-
04
The team acts
Supervisors recognize good practices and follow up on low ratings.